Friday, April 19, 2024
Fair, 85°Wind: 11.5 mph, S

Welcome to our new web site!
To give our readers a chance to experience all that our new website has to offer, we have made all content freely avaiable, through October 1, 2018.
During this time, print and digital subscribers will not need to log in to view our stories or e-editions.
A report written by a professor and a doctoral student in New Mexico State University’s Department of Economics, Applied Statistics and International Business shows that New Mexico continues to rank in the bottom 10 among states in terms of economic diversity.
The report, written by NMSU professor Richard V. Adkisson, who holds the Garrey E. and Katherine T. Carruthers Endowed Chair in Economic Development, and Sajid Al Noor, a candidate for a doctor of Economic Development degree, was completed in December 2018 and released this month as part of the NMSU Arrowhead Center’s annual release of economic base studies.
The purposes of the studies include understanding regional economic growth, short- and long-term forecasts, identification of potential growth sectors and identification of potential problem areas, NMSU said in news release. The studies also give an indication of an area’s strength compared to the state and the nation.
The study’s findings include the following:
For 2016, New Mexico was ranked 42nd using the Hachman index, 47th using Herfindahl-Hirschman and 45th using the Entropy Index. (The Hachman Index, developed by Frank Hachman, was first published by the University of Utah’s Bureau of Business and Economic Research in 1994. The index measures the extent to which a region’s employment distribution resembles that of a reference area. The NMSU study calculated the Hachman Index for all 50 states for 11 years, 2006-16. The Herfindahl-Hirschman and Entropy indices compare a state only to itself.)
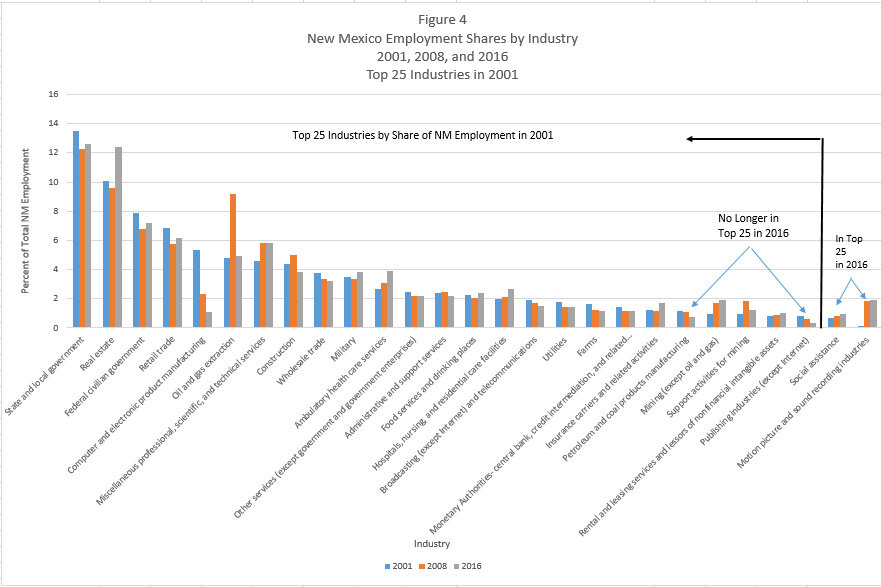
electronic product manufacturing, which dropped from fifth to 23rd in ranking and 5.36
percent to 1.12 percent in employment share. Wholesale trade and broadcasting and
telecommunications had more modest declines in employment share. The petroleum and coal
products manufacturing and publishing industries dropped out of the top 25 industries by 2016.
the Hachman, Hirfendahl-Hirshman and Entropy indices, it appears New Mexico has
become only slightly more economically diverse over the 2001-16 period. While progress has been made, other states have progressed too, making it difficult to move up in the diversity rankings.
In terms of employment shares, there have been a few notable changes within the state with
decreases in some industries being offset by increased shares in other industries. Realistically,
New Mexico, as any other state, has its own unique characteristics that shape its economy. While
the pursuit of economic diversity is worthwhile in many ways, it may be unreasonable to expect
New Mexico, or any other state, to change its diversity ranking significantly in a short amount of
time.
To access the studies, visit https://arrowheadcenter.nmsu.edu/economic-and-policy-studies/.


