Monday, September 16, 2024
Clear, 87°Wind: mph,
Welcome to our new web site!
To give our readers a chance to experience all that our new website has to offer, we have made all content freely avaiable, through October 1, 2018.
During this time, print and digital subscribers will not need to log in to view our stories or e-editions.
Dust off your casserole recipes; the Rust Belt isn't out of the game just yet. With a third of Americans saying climate change is a reason they'll consider moving this year, the relative safety of cities from New York through the upper Midwest from hurricanes and wildfires (along with their millennial and Gen-Z-friendly prices) has reenergized a region once thought hopelessly outdated.
moveBuddha predicts that in 2024, Rust Belt cities will see an uptick in migrations.
Which cities have the best chance of seeing a revival in 2024?
Last-placers Gary, IN, and Hammond, IN are at the bottom of GDP growth over the last five years. They're also at the bottom of moveBuddha's move interest data, with the lowest move ratios of .33 and .56, respectively.
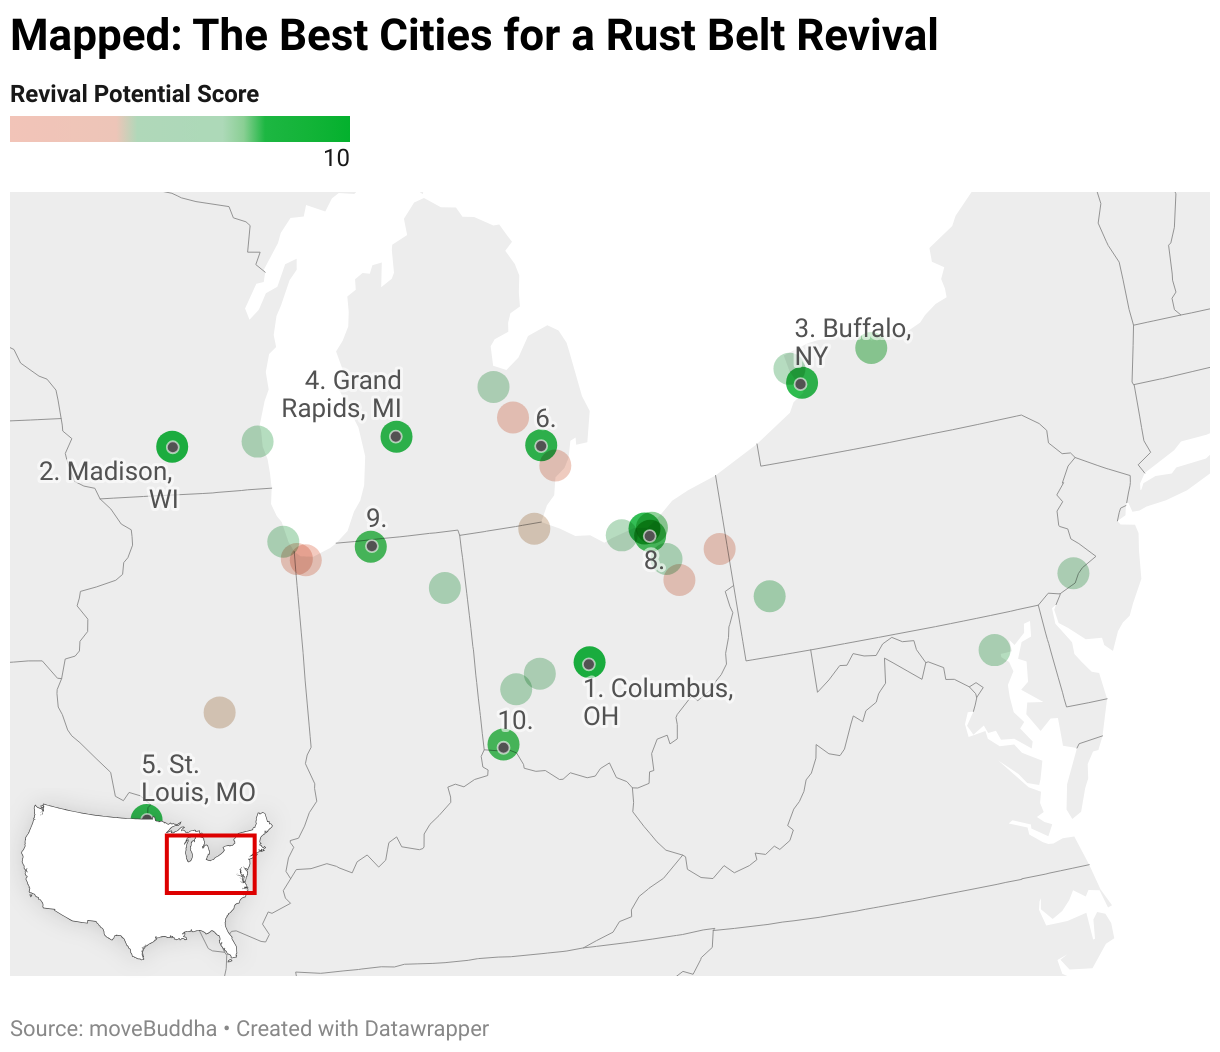
moveBuddha looked at the region's 32 largest cities with sufficient mover search volume to find those with populations that are trending upward and boast a strong local workforce with housing availability and affordability.
Badger vs. Buckeye? No, it's not a riddle. It's a decision many would-be Rust Belt newcomers face between two towns best known for their football fervor.
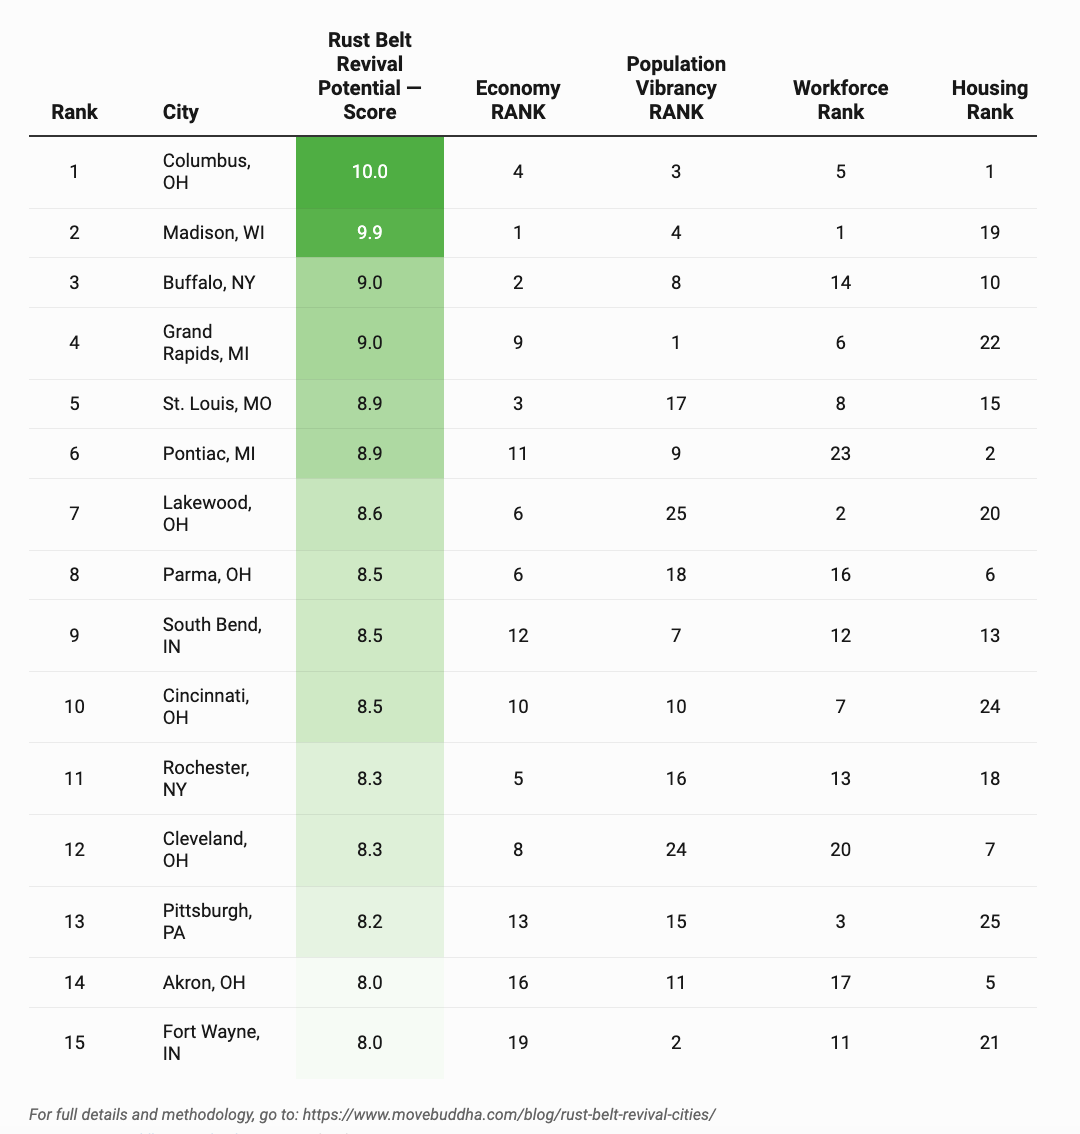
#1 Columbus, OH, ranks first in housing and in the top five for all four categories, with a growing economy, including in "new collar" high-tech manufacturing. While newcomers like the college-town vibes, the brick houses of German Village and grabbing a pint of Jeni's ice cream at its original home in North Market, they really love its housing affordability. The average home here costs just 3.87 times the median income, averaging $248,838, 42% less than the average U.S. home.
#2 Madison, WI, fares much worse for housing than Columbus, OH, coming in at a mediocre #19 among the 32 ranked cities, but beating all other competition in two categories: Economy and workforce. With the region's most highly educated talent pool (and grabbing 90% of its in-migration from Gen Z), Madison also has the lowest unemployment and highest GDP growth over the last five years in the top 10.
Both cities highlight why university towns are best poised to make a comeback this year. Along with #4 Grand Rapids, MI, and #9 South Bend, IN, these cities' highly educated populations have helped spur economic innovation that other cities have yet to see.
But there are other ways to invest in growth. #3 Buffalo, NY, has excelled with recent GDP growth since the pandemic and high rates of new business formation. Its success might stem from the federal cash it scored for in its designation as an official I-Corridor Tech Hub.
Two suburbs of Cleveland make the list: #7 Lakewood, OH, with its sky-high GDP-per-capita growth since the pandemic, which has likely helped it decimate unemployment over the past year. #8, Parma, OH has a similar economic success story with a higher diversity score and lower housing costs. It also got the highest score overall for keeping its families out of poverty.
Cities like Lakewood, Parma, and #6 Pontiac, MI, seem anomalous when their core downtowns are struggling to retain residents. While they shine in different categories, all these enclaves rank in the top 11 economically, with high GDP ratios per capita in areas with low unemployment.
Rust Belt Revival Rank
It isn't called the Rust Belt for nothing. In fact, cities that are finding it hardest to reinvent themselves were some of the most prosperous steel and manufacturing towns of yesteryear, and they felt the blow the strongest when those industries declined.
Unsurprisingly, Gary, IN, called the country's "most dangerous city," is least positioned for revival in 2024. "Scary Gary" is tied for the worst economic growth over the last five years, with negative GDP growth since 2017. It's got the worst population growth score according to moveBuddha searches. It is tied for third place for the worst unemployment and the highest poverty in the region.
Neighbor Hammond, IN, and more distant Canton, OH, which also relied on steel, don't fare much better. Both score in the bottom 10 in all categories with a single exception: with a comparatively high median household income compared to Gary, Hammond's housing costs can feel quite affordable.
Flint, MI, and Detroit, MI, continue struggling to redefine themselves in an era without their historically large car manufacturing and steel manufacturing employers. The hollowed-out populations left behind today are those with low educational attainment. That's meant the city hasn't successfully parlayed its manufacturing know-how into today's higher-tech manufacturing jobs, as cities like Columbus and Pittsburgh have.
Overall, of the 32 cities analyzed, the cities that are least likely to enjoy a comeback are some of those with the biggest past successes and, consequently, the most bruising recent economic tumbles:
Rust Belt Revival Rank
In short, Rust Belt revival cities have a growth-mode economy.
Our ranking of the best Rust Belt cities factors in economic growth, community vibrancy, workforce and housing. Collectively, these pillars can power up a Rust Belt city.
But some cities excel in specific categories.
Strong growth means big opportunities for newcomers' careers, along with extra restaurants, shopping, sports and entertainment in the metros that are consistently earning new businesses.
So, moveBuddha measured each city's economic productivity by looking at GDP per capita in 2022 (9%), long-term growth via GDP growth from 2017-2022 (7%) and short-term growth post-pandemic (5%), in addition to evaluating entrepreneurial activity, job market health, employment trends and federal investment.
Best Cities by Economic Factors
Worst Cities by Economic Factors
#11 Rochester, NY, barely missed the top 10 overall winners but joined with other top performers in the economic health category. No single factor dominated this category. For instance, St. Louis, MO, is #1 in the region for GDP growth since the pandemic, coming back strong GDP per capita. Rochester and Buffalo, NY, are strong in new business formation. Madison, WI, comes in #2 with rock-bottom unemployment.
Economic stragglers include lakefront cities that once moved steel across an industrializing nation. Today, they're struggling to find new ways to grow. Toledo, OH, Lorain, OH, and Flint, MI, recorded negative GDP growth from 2021 to 2022.
In what moveBuddha deems the "vibrancy" factors, these cities are maintaining strong inflow, supporting their families and creating strong multiculturalism that in turn, can buoy innovation and a cross-pollination of ideas.
moveBuddha analyzed population growth over a decade (10%), demographic diversity using Simpson's Diversity Index (5%) and community well-being indicated by the poverty score (5%).
Best Cities by Population Vibrancy Factors
Worst Cities by Population Vibrancy Factors
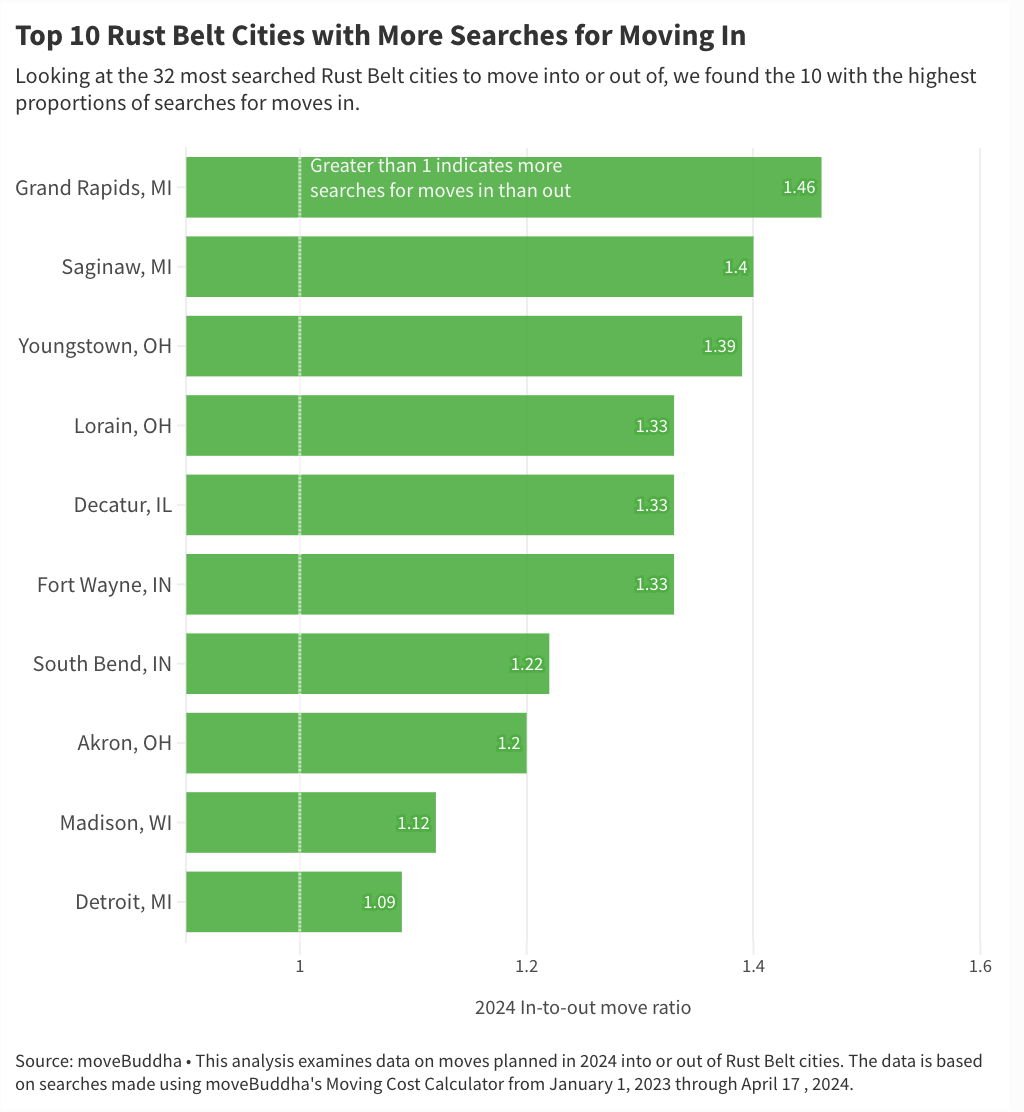
Grand Rapids, MI, is the most popular Rust Belt city according to moveBuddha's mover search data, with 1.46 requests for moves to town for every request to leave. That gels with its population growth score over the past ten years, which has increased 2.4%. Add that to low poverty (just like in Madison, WI, and Fort Wayne, IN), and you get a recipe for high population health, with new, diverse residents and low poverty.
The worst cities? Flint, MI, Gary, IN, and Detroit top the list. All come with some of the worst poverty scores. At the same time, Gary, IN and Flint, MI, also rank last in population growth and interest in moveBuddha data — in Gary, more than three residents move away for every newcomer.
New ideas are percolating in these rising-star cities, with educated residents helping drive new opportunities for all, which should only compound their popularity.
This evaluation encompasses educational attainment (8%), indicating the percentage of the population with a college education or higher, and labor market vitality (7%) assessed through labor force participation percentage.
Best Cities by Workforce Factors
Worst Cities by Workforce Factors
Madison, WI, Pittsburgh and Chicago all rank in the top five for workforce power with high worker education scores. Columbus, OH, Madison, WI, and Chicago are also in the top five for workplace participation.
On the other hand, poor performers all lie near the bottom of the pile for educated workers, which helps explain their low workforce participation rates. These two factors are strongly correlated, with the least educated workers remaining in economically disadvantaged areas as GDP falters and employable workers head elsewhere, making it even less likely the city can stage a comeback.
To find gems where housing is a good investment and where new building projects ensure that housing is available as a city grows, moveBuddha looked at housing affordability relative to income (8%), market balance — measuring demand against supply (6%), construction activity (6%) and home values appreciation trends (5%).
Best Cities by Housing Factors
Worst Cities by Housing Factors
While increased demand can raise housing prices, it has a less direct relationship than other economic indicators. Take Lorain, OH, which lies near the bottom of the pile for poverty and workplace participation but can brag about more in-moves than moves away. And it has one of the region's top five strongest income-to-housing ratios.
Columbus, OH, enjoys a healthy balance between supply and demand, strong new housing starts and affordable homes.
The worst city for housing, Philadelphia, PA, is a top five jewel for social and population factors, with a vibrant and diverse community. But it's got the worst balance between supply and demand and high housing prices vis à vis income.
moveBuddha searches point to what will happen as 2024's summer moving season gets underway. This data doesn't rely on last year's census updates, so it's possible to predict which cities are heating up better.
Surprisingly, the current most popular cities for moveBuddha searches aren't always top in their categories. Three of the top 10 cities — Madison, WI, Grand Rapids, MI and South Bend, IN — already see strong moving interest.
Watch for these cities to grab even more of the Rust Belt pie as new moves herald new economic opportunities, businesses and diversity.
But it's also worth paying attention to the moving interest seen across Rust Belt cities, since many are grabbing the attention of newcomers while they continue to struggle economically. Those in-moves might be just the ticket to help spark new economic activities and bring a breath of fresh air to cities that haven't found ways to break out of the rust quite yet.
And who knows, they might be next year's top contenders for the Rust Belt's up-and-coming revival cities.
The Rust Belt is an unfortunate nickname that depends on believing that a region's best days are entirely in the past. The name seems to suggest that you can embrace the rust, but you can't wash it off.
Tell that to Columbus, OH, and these other up-and-coming cities, which have plenty to offer today, from affordable housing for new grads to jobs engineering silicon chips.
Perhaps, like no other region, moving to a Rust Belt revival city takes a certain kind of vision to see the potential in what others find out of fashion.
And no matter which Rust Belt revival city they choose, more movers are doing exactly that.
moveBuddha analyzed Rust Belt cities based on their revival potential across four key categories and 16 factors. Scoring is based on the weights indicated in parentheses.
Economy (40%)
The economy is a primary indicator that a Rust Belt city is on the path for a revival. These factors highlight the productivity and strength of the local economy.
Population Vibrancy (20%)
Population growth and desirability indicate a city people actually want to live in and are already making gains, highlighting further potential for economic expansion.
Workforce (15%)
For a revival with staying power, a robust local workforce will draw in new businesses and spark innovation.
Housing (25%)
Housing isn't just about affordability, though that certainly factors in. Is there enough housing available for a growing city? Is there a demand and supply balance? Are home values appreciating?
Scoring
Factor score: Each individual factor was scored on an equal-weighted scale, where 10 is the highest score.
Category score: For each category score and subsequent rank, moveBuddha took the factor weight indicated in parentheses to score the category factors. For each category moveBuddha applied a simple ranking where the city with the highest score from one to 10 received a rank of #1.
Rust Belt Revival score: Taking each category score and its given weight, moveBuddha found the score for each city on a scale of one to 10 to find the final score and ranking of Rust Belt cities.
This story was produced by moveBuddha and reviewed and distributed by Stacker Media.


